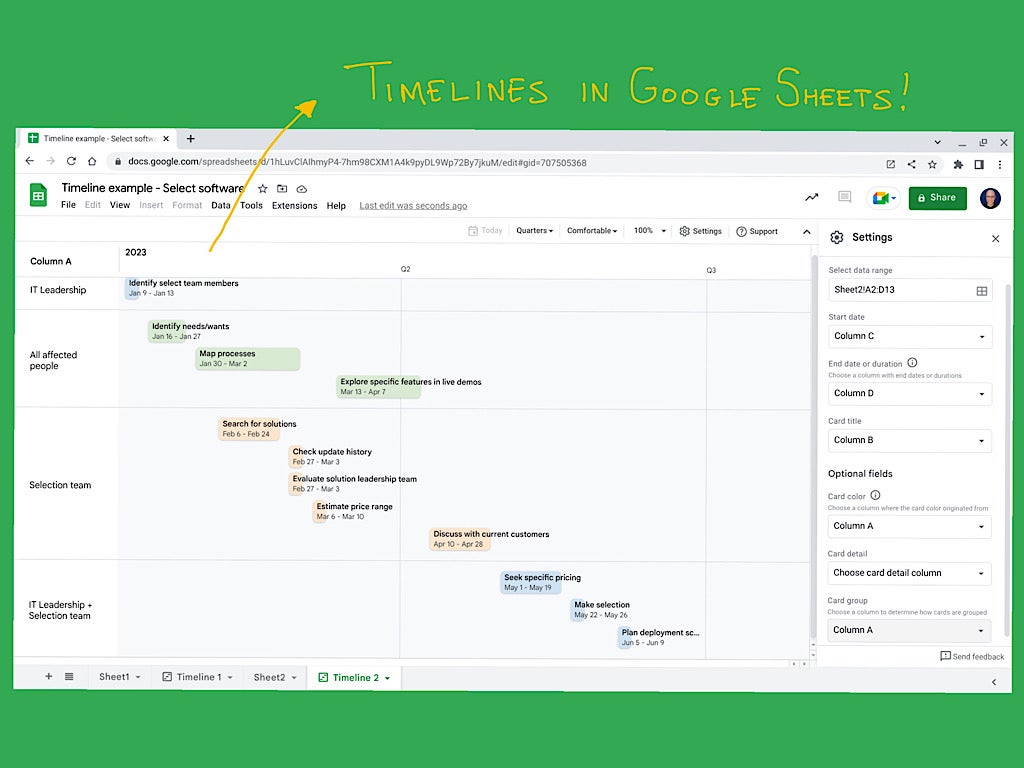
In November 2022, Google Sheets added a timeline view, which lets you select a set of cells that contain text and dates and create a new spreadsheet tab that displays those items in a horizontal timeline where each event row displays as a discrete item in the timeline. This type of timeline may be most useful to visualize future events, such as project plans or forecasts. It also may aid understanding of past events, such as for after-action analysis or historical studies.
SEE: Google Sheets: Tips and tricks (free PDF) (TechRepublic)
To create or display timelines, you’ll need to use Google Sheets on the web with a desktop browser, such as Chrome.
1. Enter events, dates and durations
First, you’ll need to enter at least two pieces of data for each event you want to display in your timeline: An event name and a date. The event name should be a word — or a few words — that encapsulates the essence of the timeline event. The date simply needs to be any standard-format year, month and day.
In many cases, you’ll also want to specify either an end date or duration of the event. This additional component of information allows the system to show not only single-day events, but also multi-day, multi-month or even multi-year events.
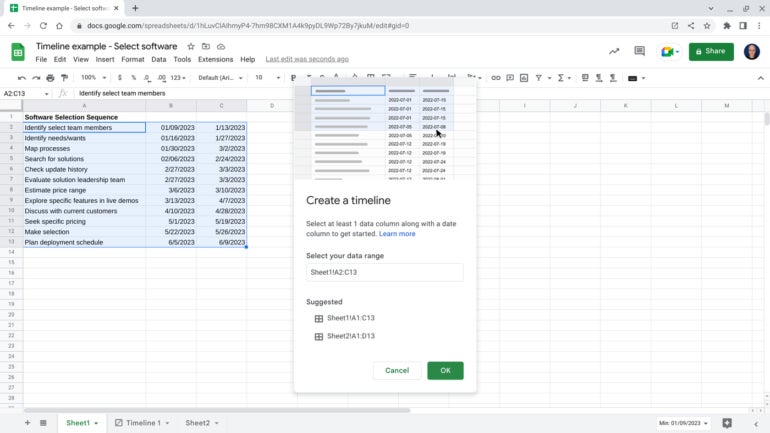
The example spreadsheet in Figure A shows a sample software selection process, with columns that indicate an activity (column A) along with separate cells that specify a start date (column B) and end date (column C) of each phase.
Figure A
2. Create a timeline
From within the spreadsheet with your entered events and dates, select Insert > Timeline. This brings up a prompt that allows you to enter the spreadsheet range for your timeline data. The example indicates that the timeline will use data in Sheet1 cells from A2 to C13, or Sheet1!A2:C13 (Figure A).
Enter the range for your timeline events and dates, then select OK. The system will create and insert a new timeline sheet, as shown in the lower-left of Figure A, between Sheet 1 and Sheet 2.
3. Modify scale
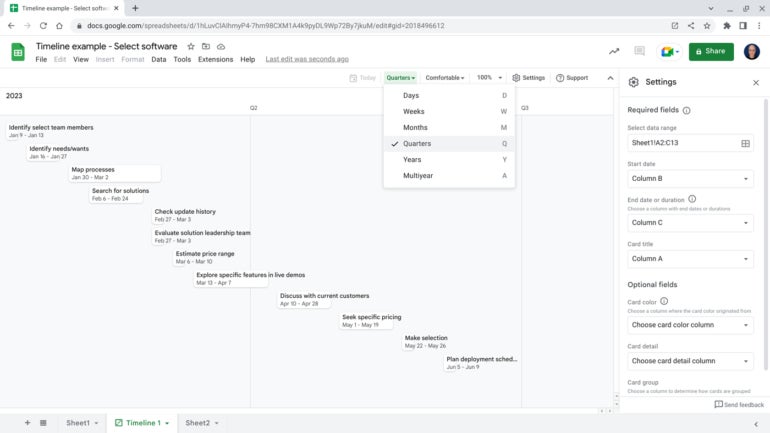
The default display of a newly-created timeline may not necessarily place all events in view. You might select one of the longer-duration options from the timescale drop-down menu (e.g., days, weeks, months, quarters, years or multiyear) to adjust the view as desired. In Figure B, I selected Quarters, for example.
Figure B
4. Optional: Group items
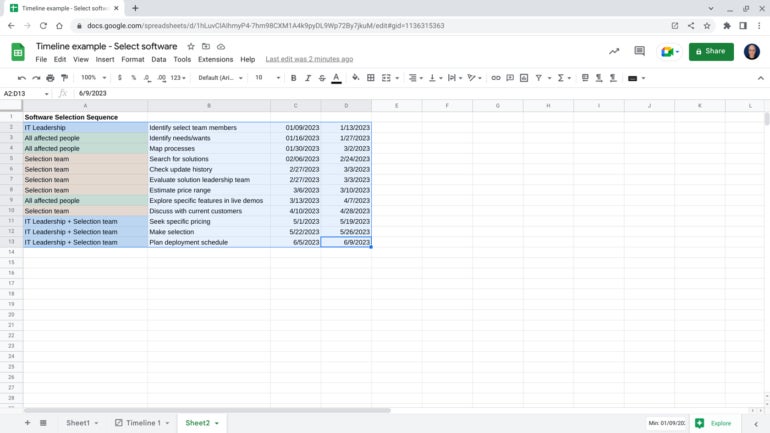
The timeline also supports the ability to group activities with the addition of another column of data. For example, you might add a column to indicate a person or team responsible for the event demarcated on each row. In Figure C, for example, column A contains the various groups responsible for each step: IT Leadership, All affected groups, Selection team, etc.
Figure C
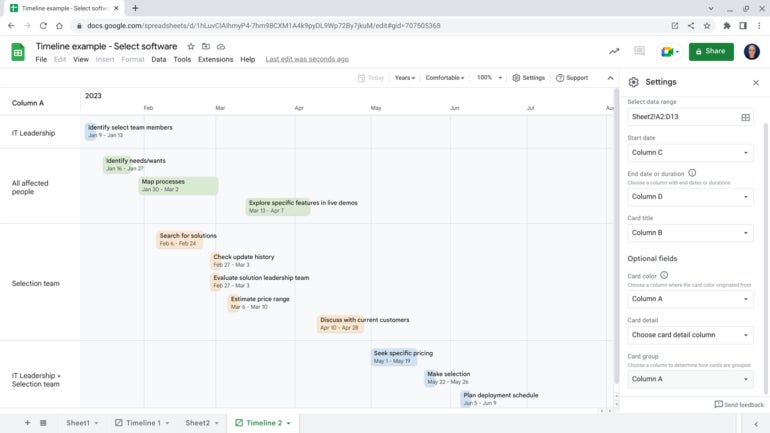
To adjust the display so items are grouped by these general categories, select Settings (between the 100% indicator and the Support options), and then, choose the corresponding column for the Card group dropdown. Figure D, for example, shows the timeline events grouped by Column A content.
Figure D
5. Optional: Customize colors
You may modify event colors in two different ways.
First, within the spreadsheet, choose one or more cells, then select the pouring paint bucket icon, and pick a fill color. For example, cells in column A in Figure C are set to different colors to indicate different groups (eg., blue for IT Leadership and green for All affected people).
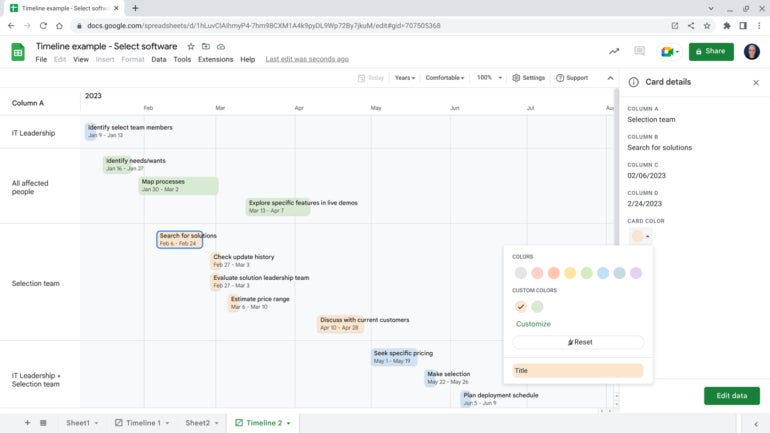
Alternatively, from the timeline display, you may select an event, which then displays the Card details to the right of the spreadsheet (Figure E). From this side panel, you may select and then change the card color as desired. The side panel also offers an Edit data button, in the lower right, which when selected, returns you to the sheet that contains the source data for the timeline.
Figure E
What’s your experience with timelines?
The ability to create, display and share timelines makes Google Sheets significantly more useful for project management. For many people, a timeline view of events is much easier to comprehend and discuss than a list of events and dates. Plus, the ability to group events makes it possible for people to focus on the specific set of tasks most relevant to their responsibilities.
Have you experimented with timeline views in Google Sheets? Do you find the standard set of events, start and end dates sufficient for your needs, or do you prefer to group events? Do you most often create timelines of future or past events? Mention or message me on Mastodon (@awolber) to let me know how you use timelines in Google Sheets.
